Overview
Descriptive statistics provides the foundation for enterprise data analysis by summarizing high-volume datasets into quantitative measures. Operating through numerical and graphical summary techniques, such as measures of central tendency (mean, median, mode) and variability (range, variance, standard deviation), descriptive statistics enables organizations to evaluate data distributions, identify anomalies, and establish baseline metrics.
In an era where the global datasphere surges past 220 zettabytes, and over 90% of enterprise information remains unstructured or complex, raw data alone can be a liability before it becomes an asset. Descriptive statistics serve as the primary engine of enterprise intelligence, condensing chaotic, high-volume datasets into clear, actionable measures of central tendency, dispersion, and distribution shape. By executing these core summary functions directly within native database environments—eliminating latency, egress costs, and security risks—organizations establish the reliable empirical baselines required to audit data quality, streamline operational decision-making, and fuel high-performing AI pipelines.
Key takeaways
- Descriptive statistics summarize numerical properties without making unwarranted population assumptions, providing crucial data quality validation.
- Complete data exploration requires measuring central location (mean, median, mode), dispersion (variance, standard deviation, interquartile range), and distribution shape.
- Running statistical transformations inside Teradata Database eliminates network latency, cloud egress fees, and the security risks that come with data extraction.
- Clean descriptive baselines sanitize feature pipelines, prevent model drift, and ensure high-fidelity inputs for artificial intelligence workflows.
Descriptive statistics in data analysis
What descriptive statistics is: The definition
Descriptive statistics condense raw data into structured mathematical and visual summaries that highlight core properties.
Analysts translate massive tables into clear indicators of central location, dispersion, and distribution shape without extrapolating beyond direct observations. In initial data exploration, descriptive statistics act as an essential quality gate. It uncovers missing values, skewed distributions, and statistical outliers that could otherwise distort downstream analytical performance.
How it fits the enterprise analytics journey
Establishing empirical baselines allows organizations across sectors to streamline operational decision-making.
- Healthcare: Aggregates patient vital signs, treatment timelines, and readmission rates to create baselines for standard care outcomes and improve clinical protocol consistency.
- Financial services: Summarizes transaction volumes, account balances, and credit score distributions to establish risk benchmarks and monitor compliance thresholds.
- Retail and e-Commerce: Analyzes average order values, purchase frequencies, and return rates across customer segments to optimize pricing and inventory allocation.
- Supply chain and manufacturing: Tracks component tolerance metrics, shipment lead times, and throughput rates to identify operational bottlenecks before costly delays occur.
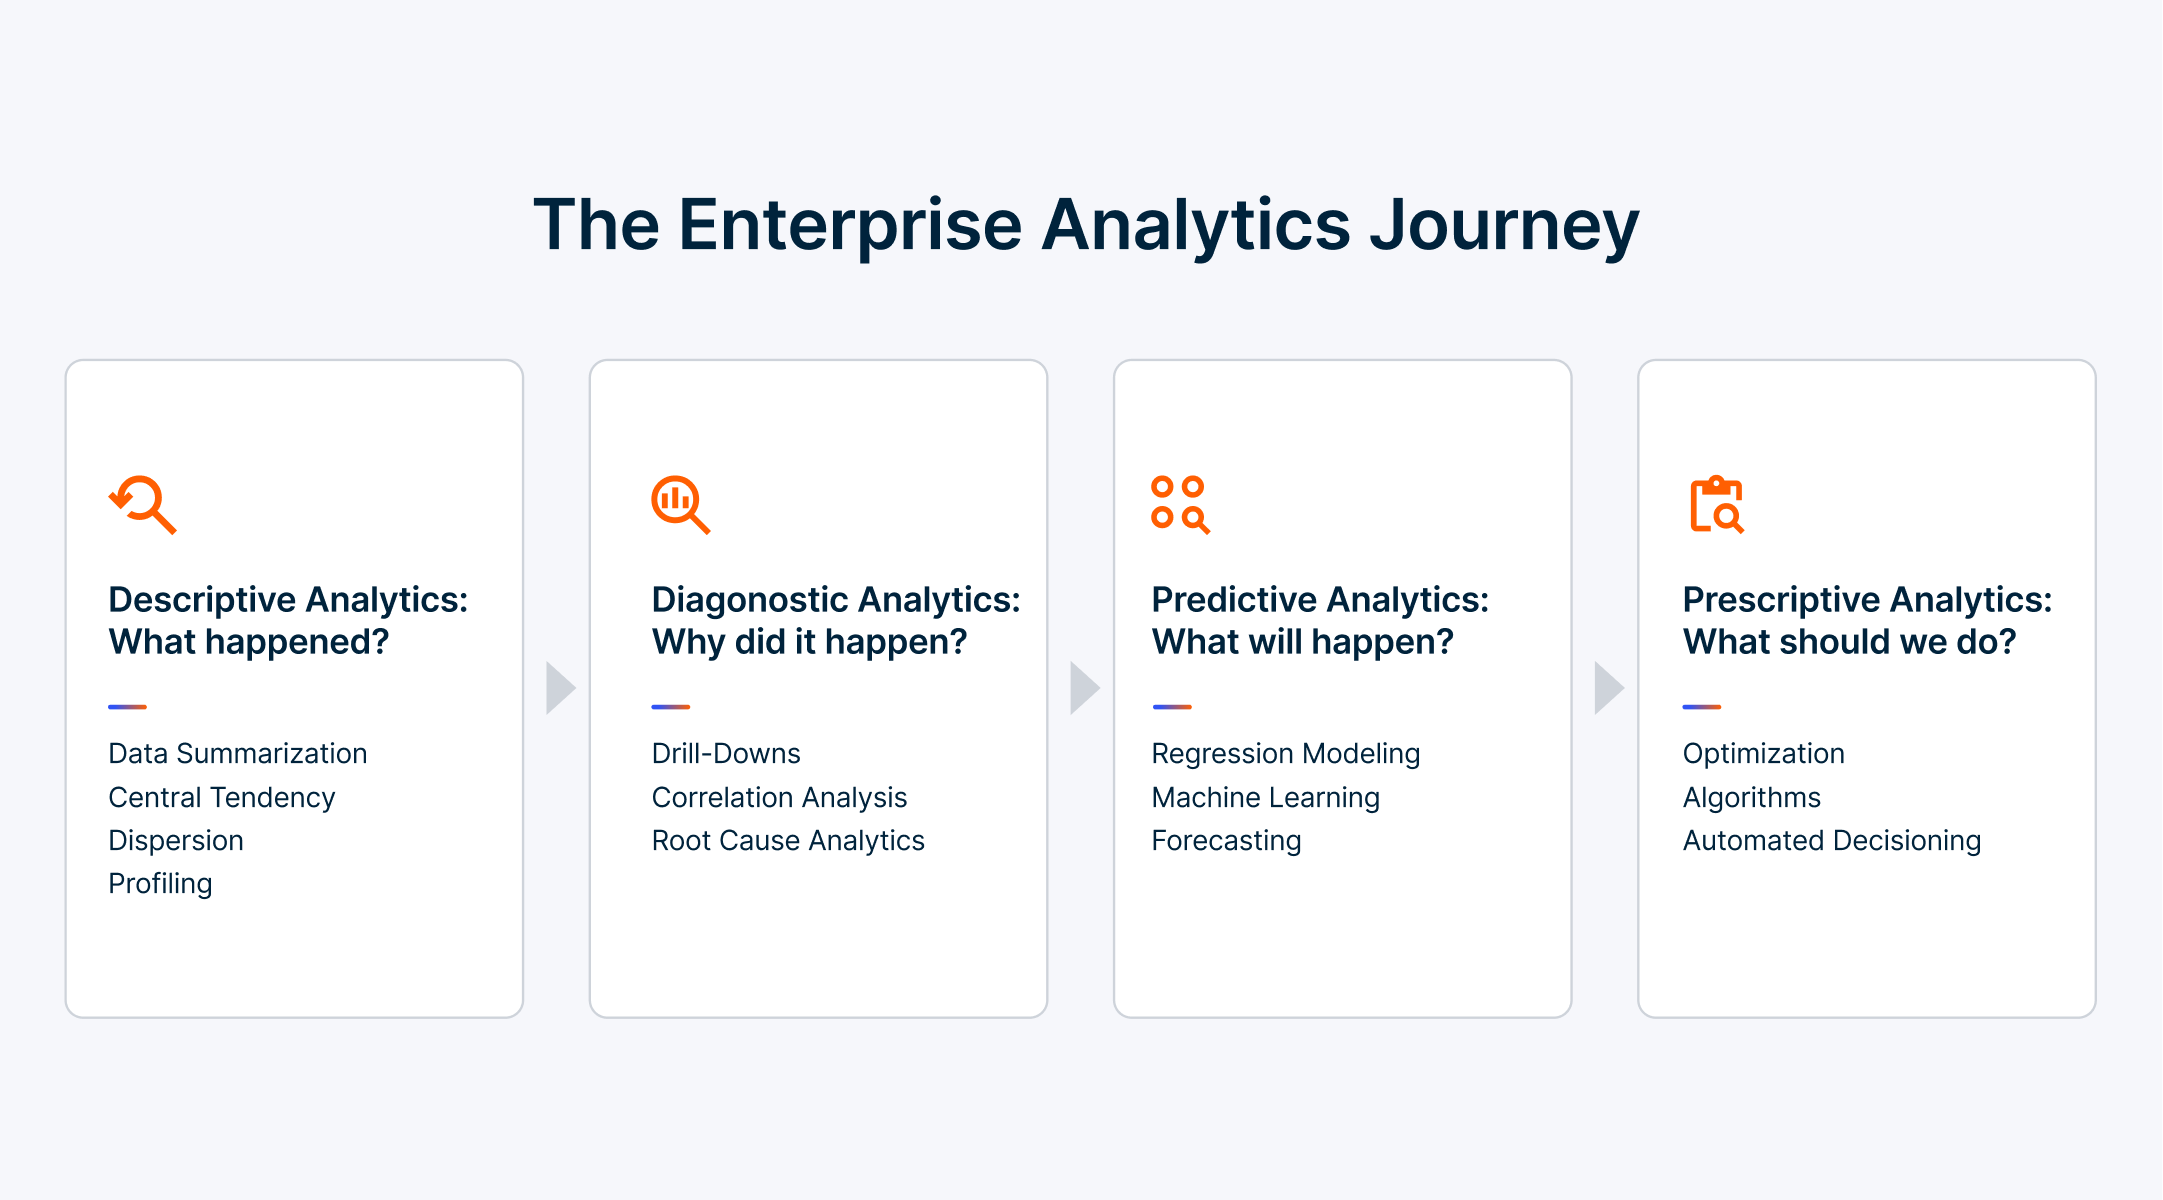
Using the Teradata platform, data teams execute these core exploratory functions directly where the data resides, eliminating the performance degradation associated with traditional data extraction. Before data engineers execute upstream data, choose transformation techniques, or deploy complex predictive models, they perform exploratory statistical analysis.https://www.teradata.com/insights/data-analytics/what-is-predictive-analytics
Business impact of descriptive statistics
From raw data to executive decisions
Empirical data summaries allow enterprise leaders to replace intuition with concrete evidence. As the global big data analytics market expands toward $447 billion, organizations that master baseline statistical summaries build stronger foundations for advanced predictive and prescriptive decision-making.
Connecting descriptive analytics to predictive models
Connecting descriptive analytics directly to predictive models creates a continuous intelligence cycle. Descriptive statistics establishes historical patterns and identifies feature relationships, enabling machine learning algorithms to forecast demand, predict customer churn, or detect equipment failure with higher accuracy. Regression techniques such as linear regression build directly on these summary measures.
- Healthcare and life sciences: Health systems aggregate patient metrics, monitor vital sign baselines, and calculate variance in recovery outcomes across patient demographics.
- Financial services: Risk managers rely on standard deviation and variance to evaluate portfolio volatility, detect anomaly patterns in credit scores, and monitor fraud rates. In smart manufacturing, these statistical methods power quality control with real-time SPC (statistical process control).
- AI and machine learning engineering: AI teams compute descriptive statistics on embedding distributions, token lengths, and training corpora to ensure balanced inputs for large language models (LLMs) and retrieval-augmented generation (RAG) pipelines.
Industry applications
|
Industry vertical |
Primary descriptive application |
Core metrics tracked |
Strategic business outcome |
|
Retail |
Sales and inventory distribution |
Mean daily sales, interquartile range of stock turnover, peak order hours |
Reduced stockouts, optimized safety stock levels, and targeted promotional scheduling |
|
Healthcare |
Clinical and patient analytics |
Median length of stay, variance in recovery times, readmission frequency |
Enhanced resource allocation, standardized care pathways, and reduced hospital costs |
|
Financial services |
Portfolio and risk profiling |
Volatility (standard deviation), average default rates, median credit scores |
Refined credit limits, improved risk-adjusted returns, and rapid fraud detection |
|
Telecommunications |
Network performance and churn |
Mean latency, variance in bandwidth usage, monthly active subscriber percentiles |
Proactive capacity planning, improved SLA compliance, and targeted retention campaigns |
|
Supply chain |
Throughput and tolerance monitoring |
Component tolerance metrics, shipment lead times, throughput rates |
Bottlenecks identified before they become costly delays |
|
AI and ML engineering |
Feature and training-data profiling |
Embedding distributions, token lengths, null counts across training corpora |
Balanced model inputs, less drift, and higher-fidelity AI outputs |
Types of descriptive statistics
Understanding data distribution requires evaluating three fundamental statistical properties: central tendency, dispersion, and relative position.
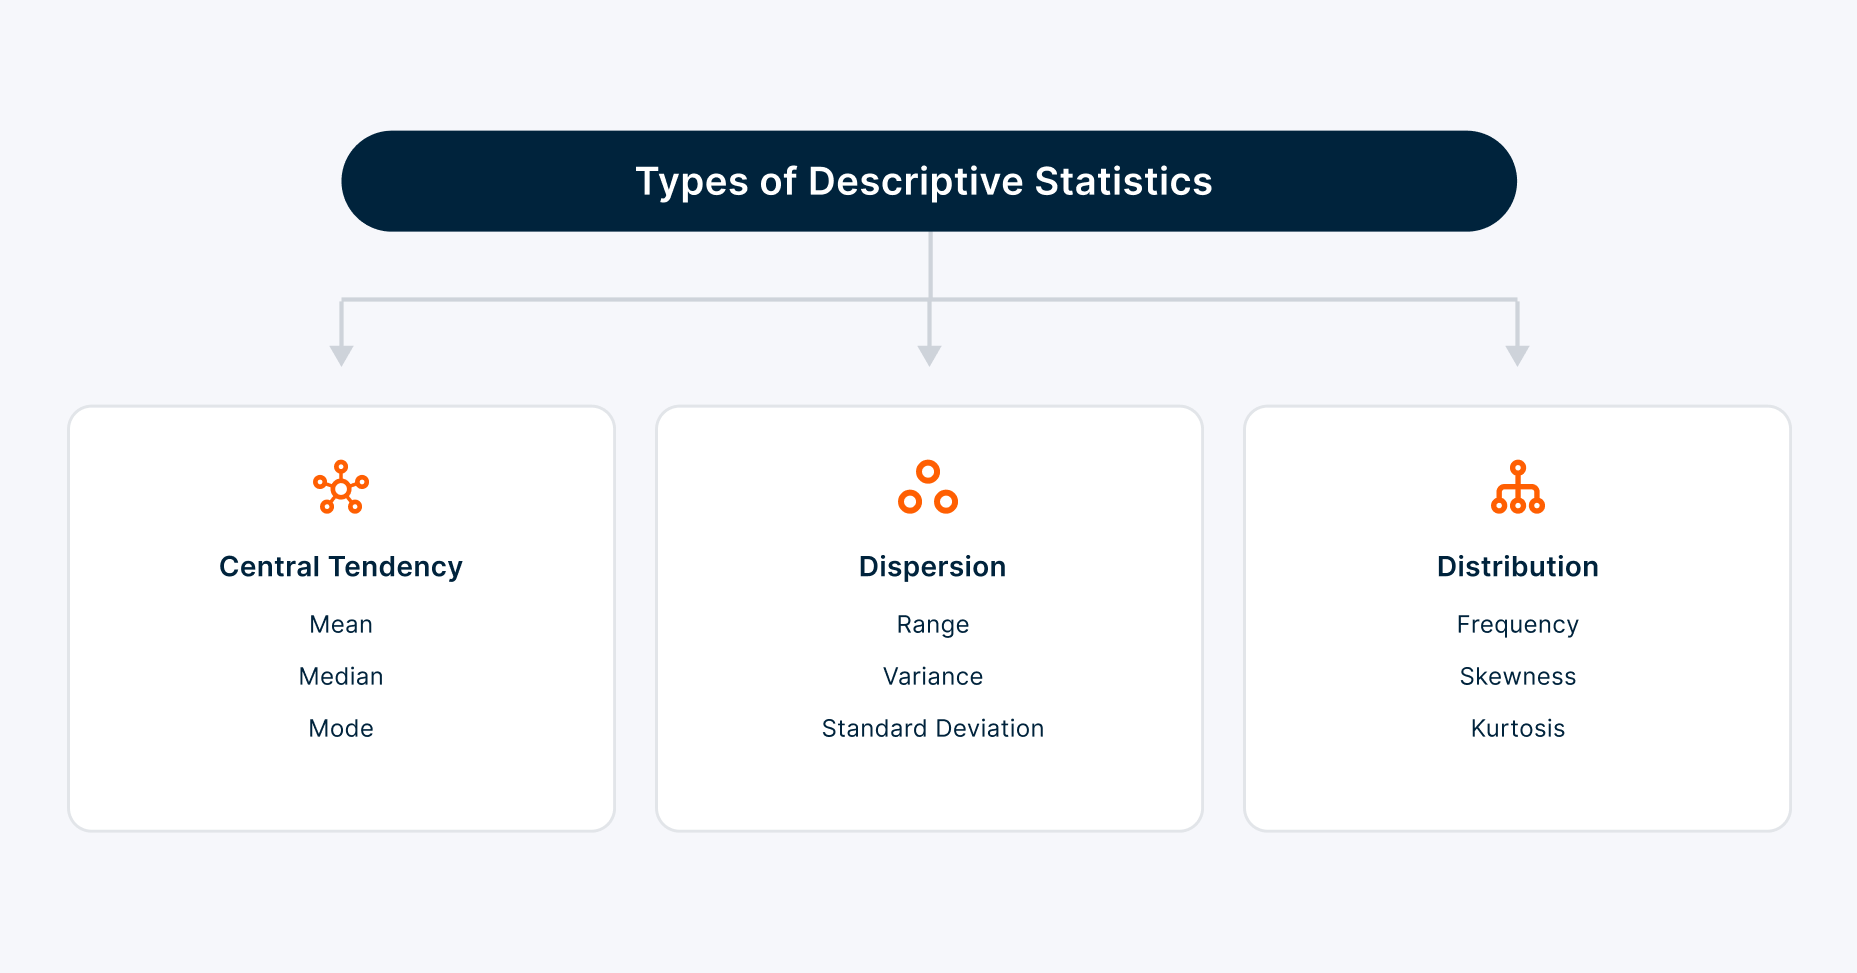
1. Measures of central tendency
Measures of central tendency identify the center point or single representative value of a dataset.
- Mean: The arithmetic average of all data points. Highly sensitive to extreme values or outliers.
- Median: The middle value when data points are arranged in order. Robust against skewed data and extreme outliers.
- Mode: The value that appears most frequently in a dataset. Useful for categorical data analysis (e.g., top-selling product SKU).
2. Measures of dispersion (variability)
Measures of dispersion describe how spread-out data points are relative to the central value.
- Range: The difference between the maximum and minimum values in a dataset.
- Variance: The average squared deviation of each data point from the mean, quantifying total dataset variability.
- Standard deviation: The square root of variance, expressing spread in the same physical unit as the original data points.
- Interquartile range: The spread of the middle 50% of values, filtering out extreme tail behavior.
3. Measures of position and frequency
Position and frequency measures describe where individual values sit within the ordered dataset.
- Frequency distributions: Tallies showing how often individual values or binned ranges occur across a dataset.
- Percentiles and quartiles: Divides ordered data into hundredths or quarters, establishing relative rankings across customers, accounts, or performance metrics.
- Interquartile range (IQR): Measures the spread of the middle 50% of values, giving a view of spread unaffected by extreme outliers.
Metrics at a glance
|
Metric |
Category |
Plain-language definition |
Best business application |
|
Mean |
Central tendency |
The arithmetic average of every value in the set |
Baseline benchmarking where the data is broadly symmetric—average handling time, average order value |
|
Median |
Central tendency |
The middle value once the data is ordered |
Any skewed distribution: salary bands, claim amounts, response times with a long tail |
|
Mode |
Central tendency |
The value that occurs most often |
Categorical data—most common failure code, most frequent basket size |
|
Range |
Dispersion |
The distance between the largest and smallest value |
A fast first read on volatility before deeper profiling |
|
Standard deviation |
Dispersion |
Typical distance of a value from the mean, in the original units |
Process control and risk sizing, where consistency matters as much as the average |
|
Interquartile range |
Dispersion |
The spread of the middle half of the data |
Outlier-resistant variability, and the basis of the box-plot fences |
|
Percentiles |
Position |
The value below which a given share of observations falls |
Service-level targets, e.g., 95th-percentile latency, 90th-percentile delivery time |
|
Skewness |
Distribution shape |
Whether the distribution leans left or right |
Deciding between mean and median before a figure reaches a report |
|
Kurtosis |
Distribution shape |
How heavy the tails are relative to a normal curve |
Flagging rare-but-extreme events in risk and fraud data |
Descriptive vs. inferential statistics
Applying the right analysis requires understanding fundamental statistical distinctions.
- Descriptive statistics: Focuses exclusively on organizing, summarizing, and presenting observed data (whether a sample or full population) without extrapolating beyond the dataset.
- Inferential statistics: Takes sample data and applies probability theory to draw conclusions, test hypotheses, or make predictions about a broader population.
Sample vs. population parameters
- Population parameter: A fixed value describing an entire group, such as the population mean or population standard deviation. Calculating exact population parameters is often cost-prohibitive or impractical.
- Sample statistic: A summary value calculated from a representative subset of the population, used to estimate the corresponding population parameter.
Univariate vs. multivariate analysis
- Univariate statistics: Evaluates a single variable in isolation—for example, the distribution of customer age—to understand its central point, spread, and shape.
- Multivariate statistics: Evaluates two or more variables simultaneously—for example, the relationship between customer age, income, and transaction frequency—to uncover correlations, interactions, and multi-dimensional patterns.
Visualizing descriptive statistics
Data visualization translates complex numerical output into intuitive graphical representations, enabling enterprise teams to detect patterns and anomalies instantly.
Key visual profiling tools
- Bar charts: Compare discrete categories against summaries like total revenue or average order frequency.
- Histograms: Display the frequency distribution of continuous numerical data grouped into bins, exposing symmetry, skewness, or multimodal distribution shapes.
- Box plots (Whisker plots): Display dataset quartiles and whiskers extending to non-outlier extremes, providing a clear visual representation of spread and potential outliers.
- Scatter plots: Plot two continuous variables along perpendicular axes to visually inspect correlations, clustering, and bivariate relationships.
Enterprise dashboard best practices
- Maintain consistent scales: Ensure multi-chart comparisons share identical axis scaling to avoid misrepresenting relative magnitudes.
- Prioritize data-to-ink ratio: Remove redundant gridlines, unnecessary 3D effects, and decorative elements that distract from statistical trends.
- Design for accessibility: Use high-contrast, colorblind-friendly palettes with explicit text labelling.
Tools for descriptive statistics
Teradata Cloud and in-database compute
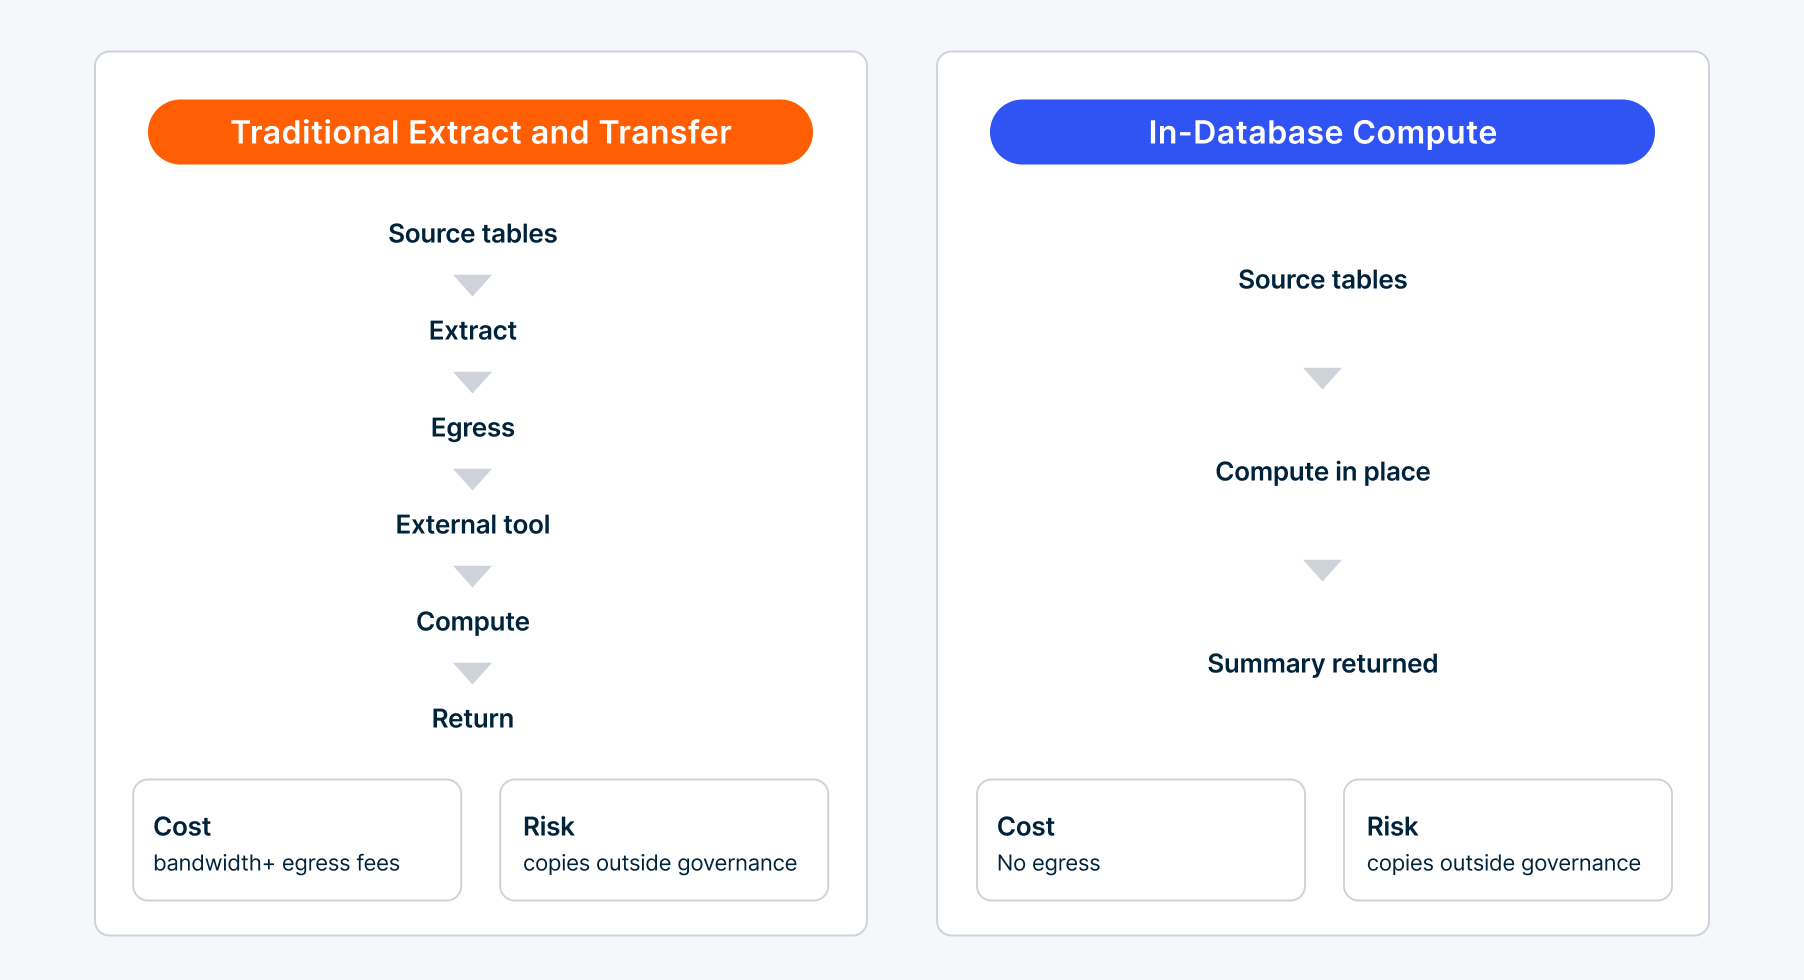
Computing descriptive statistics across multi-terabyte or petabyte-scale datalakes using external software tools introduces high latency, security risks, and egress costs. Modern analytics architectures rely on in-database processing instead.
Cloud provides connected multi-cloud data engineering and analytics capabilities. The in-database analytics features of Teradata Database execute statistical computations directly on the underlying storage architecture:
- Zero data movement: Compute summary statistics across petabyte-scale tables where the data resides, eliminating extraction penalties.
- Massively parallel processing: Execute summary functions—mean, standard deviation, percentiles—across billions of rows in seconds.
- Active compute: Delivers dedicated, always-on processing capacity for continuous, high-concurrency exploratory workloads.
In-database analytic functions
Operating as a specialized function set, the in-database analytic functions of Teradata Database provide dedicated capabilities engineered for descriptive statistics, data exploration, and feature engineering.
|
Function group |
What it computes |
Where it helps |
|
Univariate and descriptive functions |
Counts, distinct values, null counts, mean, variance, standard deviation, skewness, and kurtosis in a single pass |
Fast data-quality profiling before modelling |
|
Frequency and histogram operators |
Frequency tables and dynamic binning structures for high-dimensional attributes, via SQL or Python |
Distribution analysis without exporting data |
|
Matrix and correlation analysis |
Covariance and correlation matrices across hundreds of numerical features concurrently |
Feature selection for predictive workflows |
|
Open-source integration |
In-database analytic functions invoked from standard Python and R via notebooks |
Familiar syntax at enterprise compute scale |
Open-source integrations and Teradata University
Teradata Database features integrate with open-source environments, allowing data scientists to invoke these analytic functions using standard Python and R syntax via Jupyter Notebooks. To build team expertise in enterprise statistical analytics, practitioners can access structured learning pathways and certification materials through Teradata University.
Handling outliers and data anomalies
Quantitative detection methods
Data anomalies and extreme outliers can severely distort descriptive summaries—shifting the mean away from the dataset's true center and artificially inflating standard deviation. Two detection methods dominate:
- Z-Score method: Measures how many standard deviations an observation lies from the mean. Points beyond three standard deviations are typically flagged in normally distributed data.
- Interquartile range rule: Identifies extreme values falling beyond upper and lower fences derived from the first and third quartiles.
Outlier management strategies
- Robust metric selection: Use median and interquartile range instead of mean and standard deviation when analyzing heavily skewed operational data.
- Data transformation: Apply logarithmic, square root, or Box-Cox transformations to reduce variance and pull extreme values closer to the center.
- Winsorization and capping: Set extreme values above or below chosen percentiles to maximum acceptable thresholds without removing rows.
- In-database cleansing: Use Teradata Database cleansing and null-replacement functions to handle anomalies automatically during pipeline ingestion.
Related concepts in descriptive statistics
- Frequency distributions and histograms: Group individual continuous measurements into uniform ranges to display distribution density.
- Percentiles and quartiles: Establish benchmark positions, such as 90th-percentile response latency, for performance evaluation.
- Skewness and kurtosis: Skewness quantifies distribution asymmetry; kurtosis measures tail thickness relative to a normal distribution, indicating the likelihood of extreme events.
- Correlation and covariance: Quantify the direction and linear strength of the relationship between two continuous variables.
- Multimodal distributions: Distributions with two or more distinct peaks, signaling separate sub-populations inside one dataset.
- Cross-tabulation: Evaluate relationships between multi-categorical variables using contingency tables.
- Weighted averages: Assign volume or importance weights to individual data points so summary metrics reflect true operational reality.
Conclusion
Descriptive statistics remain the cornerstone of enterprise data analytics. By providing reliable summaries, identifying data anomalies, and establishing baseline trends, statistical summaries ensure that downstream business initiatives and advanced AI models are built on accurate data foundations. For the wider picture, see how AI is used in data analytics.
Organizations can scale statistical analytics across cloud ecosystems by executing descriptive functions directly within their enterprise data platforms. By eliminating data movement, teams reduce computation time, enhance security, and lower analytics infrastructure costs. Platform selection matters here—see choosing the best data analytics tools.
Ready to Accelerate Enterprise Intelligence?
Stop wrestling with data extraction bottlenecks and costly egress fees. Experience the speed, scale, and security of executing descriptive statistics and advanced analytics directly where your data resides using Teradata Database.
Ready to see how in-database analytics can elevate your data workflow?
- Explore hands-on learning paths and analytics courses at Teradata University.
- Experience enterprise-grade in-database analytics firsthand with Teradata Trial.
Frequently asked questions
What is descriptive statistics?
What is descriptive statistics?
Descriptive statistics is the branch of statistics that summarizes and describes the main features of a dataset without drawing conclusions beyond it. It condenses large volumes of raw records into measures of central tendency, dispersion, and distribution shape—mean, median, standard deviation, percentiles—so teams can see what a dataset actually contains before modelling it.
What are the main types of descriptive statistics?
What are the main types of descriptive statistics?
There are three main types of descriptive statistics: 1. Measures of central tendency (mean, median, mode) identify a representative value. 2. Measures of dispersion (range, variance, standard deviation, interquartile range) describe how far values spread from that center. 3. Measures of position and frequency (percentiles, quartiles, frequency distributions, skewness, kurtosis) describe where values sit in the ordered set and the shape of the distribution.
What is the primary business purpose of descriptive statistics?
What is the primary business purpose of descriptive statistics?
The primary purpose of descriptive statistics is to replace intuition with evidence. Summarizing operational data into stable baselines lets leaders benchmark performance, detect anomalies before they compound, and audit data quality before it reaches reporting or an AI model. It is the quality gate that determines whether everything downstream can be trusted.
What are common enterprise examples of descriptive statistics?
What are common enterprise examples of descriptive statistics?
Enterprise examples of descriptive statistics include average order value and return rate in retail; readmission rates and treatment timelines in healthcare; transaction volumes and credit-score distributions in financial services; component tolerances and shipment lead times in manufacturing. Each is a summary measure computed across a full population of records rather than a sample.
What is the difference between descriptive and inferential statistics?
What is the difference between descriptive and inferential statistics?
Descriptive statistics organizes and summarizes the data you actually hold and makes no claim beyond it. Inferential statistics takes a sample and applies probability theory to draw conclusions about a wider population, producing estimates with a stated confidence level. Descriptive statistics answers what happened; inferential statistics estimates what is likely true elsewhere.
How does Teradata support descriptive statistics at enterprise scale?
How does Teradata support descriptive statistics at enterprise scale?
Teradata Cloud runs summary functions through the in-database analytic capabilities of Teradata Database, executing calculations where the data already resides instead of extracting it. Massively parallel processing computes univariate summaries, frequency distributions, variance, and correlation matrices across billions of rows using active compute or elastic compute, without egress costs or added attack surface.